The Global Dashboard is meant to show the health of all connected XProtect management servers (sites) in one tab. Below is an outline of the different features.
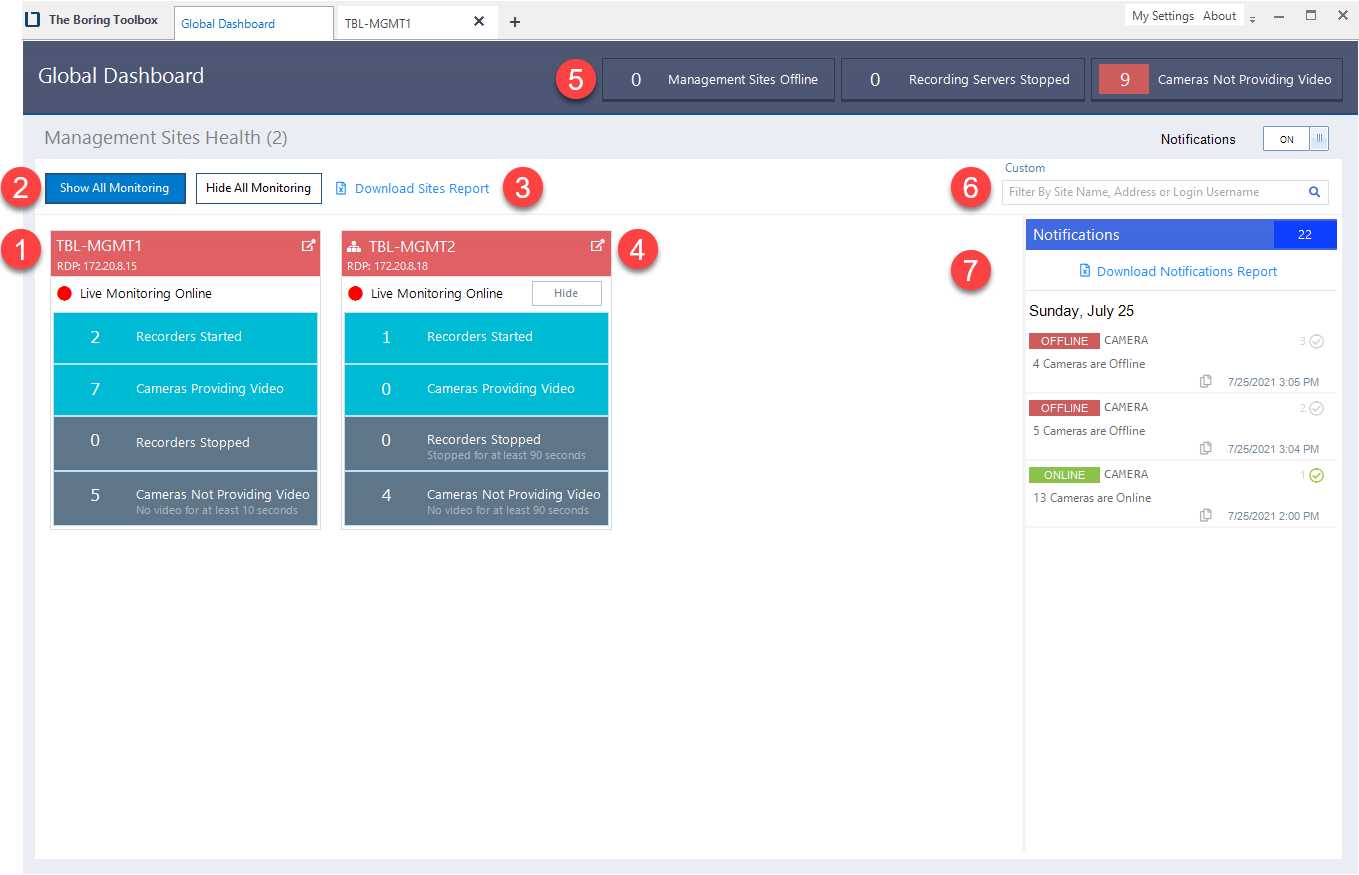
1) Site Tiles
- Site Tiles show the health of each of the sites connected to the Boring Toolbox. You can verify health at a glance by the color of the tile header.
- Green = Healthy
- Red = Needs attention
2) Show/Hide all Monitoring
- By default the global dashboard tiles for manages sites are not populated. To see the health of all the sites you can toggle them all on or off by using these buttons.
3) Download Global Report
- From the dashboard you can download a report with the status of all connected cameras across all managed sites with monitoring shown
4) Pop the managed site into a tab
- From the site tile, you can press the arrow and connect to the managed site in a new tab within the Boring Client
5) Global Statistics
- Global statistics will give you a quick numerical value of how many sites, recording servers and cameras are down or having issues throughout all connected sites.
6) Managed site Search
- Search for managed sites by name, IP address or user login name
7) Notifications Center
- The notifications center is a real-time running notifications list of sites, recording servers and cameras going up and down. You can even download these notifications into Excel.
Comments
0 comments
Please sign in to leave a comment.